Jason Kirby
Jul 14, 2023
If you’re a founder, revenue leader, or finance leader at a Seed to Series A SaaS or subscription startup, this guide is for you. For any startup with recurring revenue, the following 4 reports are essential to running your business. Once you reach Product-Market Fit, it’s hard to manage a rapidly growing startup without them and impossible to fundraise. Each report measures and helps you manage a core aspect of the business:
💰 Revenue Model: Unless your users are the product, revenue must be your north star metric.
💸 Cash Burn Model: Know your burn rate, runway, and if you’re default alive or default dead.
📊 Cohort Retention Report: SaaS startups live or die by retention - you have to get this right.
🎯 Acquisition Funnel Report: New customers are the lifeblood of your business.
Go in this order, and you’ll get the insights you need at a pace you can act on them. Let’s walk through each of these core reports.
Go in this order, and you’ll get the insights you need at a pace you can act on them. Let’s walk through each of these core reports.
I. Revenue Model
What It Is
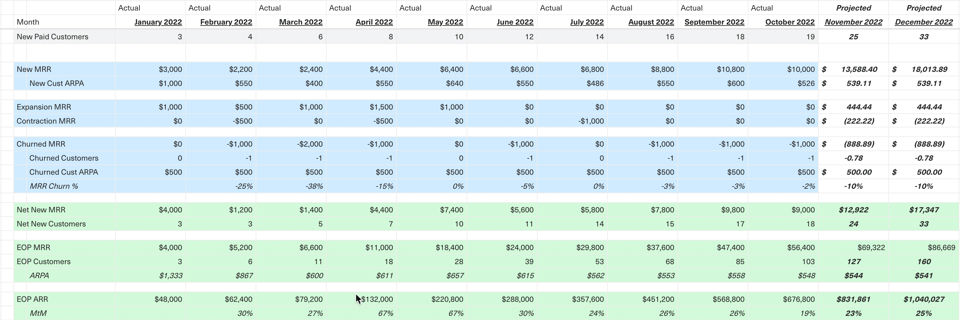
The Revenue Model gives you a single view of past, present, and future Monthly Recurring Revenue (MRR) by its components. It reveals how dependent your MRR is on new customers vs. retaining and expanding existing ones, whether churn is a problem and more.
Why It Matters
The Revenue Model lives in a spreadsheet (we recommend Equals) and allows you to forecast future MRR based on trends to date, consider changes at the component level (e.g. increased new MRR), and even model what it takes to achieve specific outcomes (e.g. what would it take to double MRR by year-end?).
Most of all, it’s a tool to evaluate the impact of your key decisions, new initiatives, or trends. It’s the core model for understanding and growing any subscription business.
How To Read It
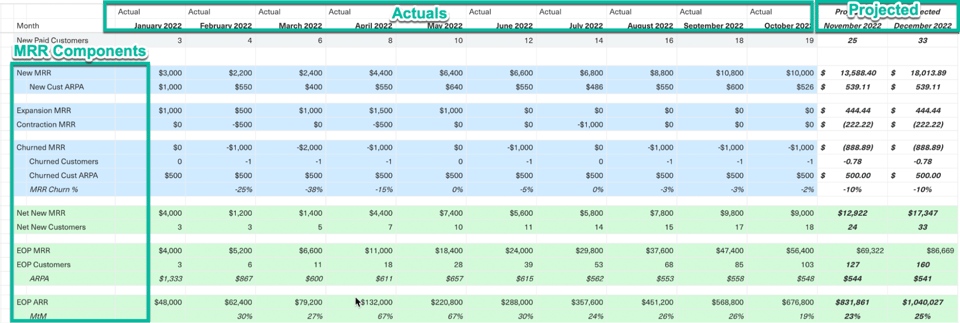
The Revenue Model shows you all the components of MRR month to month.
Total MRR = New + Retained - Churned + Expansion - Contraction + Resurrected
Each row of the Revenue Model is a component of MRR and each column is a calendar month. They will often include projections for future months.
NOTE: we recommend you include your core acquisition funnel stages in this model so you can see how you’re acquiring customers and get a holistic view of your full funnel ( bowtie funnel )
How To Use It
The Revenue Model will allow you to systematically analyze revenue and take action to grow it.
There are 3 jobs you’ll regularly need to do:
There are 3 jobs you’ll regularly need to do:
- Review your funnel and MRR components to know if you’re on track
- Ex: Did we hit our target for Expansion MRR last month?
- Ex: Did we hit our target for Expansion MRR last month?
- Decide if anything needs to be done and do it
- Ex: If we missed our Expansion MRR target, let’s dig into why and take action to hit our target this month.
- Ex: If we missed our Expansion MRR target, let’s dig into why and take action to hit our target this month.
- Follow up on actions taken
- Ex: One week later, are we closer to our Expansion MRR target and did our actions help?
In addition to day-to-day management, the Revenue Model helps you set goals, understand long-term trends, and model any scenarios you wish, by projecting the impact of changes to components of MRR.
II. Cash Burn Model
What It Is
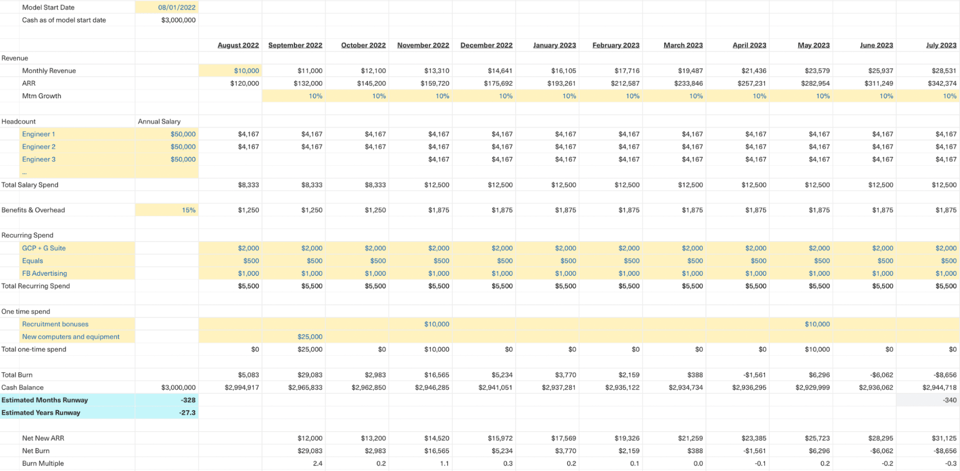
This spreadsheet model provides a single view of revenue, headcount costs, recurring spend, and one-time spend that helps you manage cash and maintain your runway. It’s the source of truth for monthly spend, monthly revenue, and your cash balance and runway.
Why It Matters
You always need to conserve cash and know how much runway your startup has left. It only gets harder to manage when you hit Product-Market Fit or hypergrowth because the volume of transactions - new customers, server and software spend, hiring, etc. - also grows rapidly.
Most of all, it helps you see if your startup is default alive or default dead. This is critical for day-to-day business and your bargaining position if you’re considering outside funding.
Most of all, it helps you see if your startup is default alive or default dead. This is critical for day-to-day business and your bargaining position if you’re considering outside funding.
How to Read It
As with the Revenue Model, each row is a component, and each column is a month. We again recommend Equals and using our template, or at minimum, an access-controlled Google Sheet.
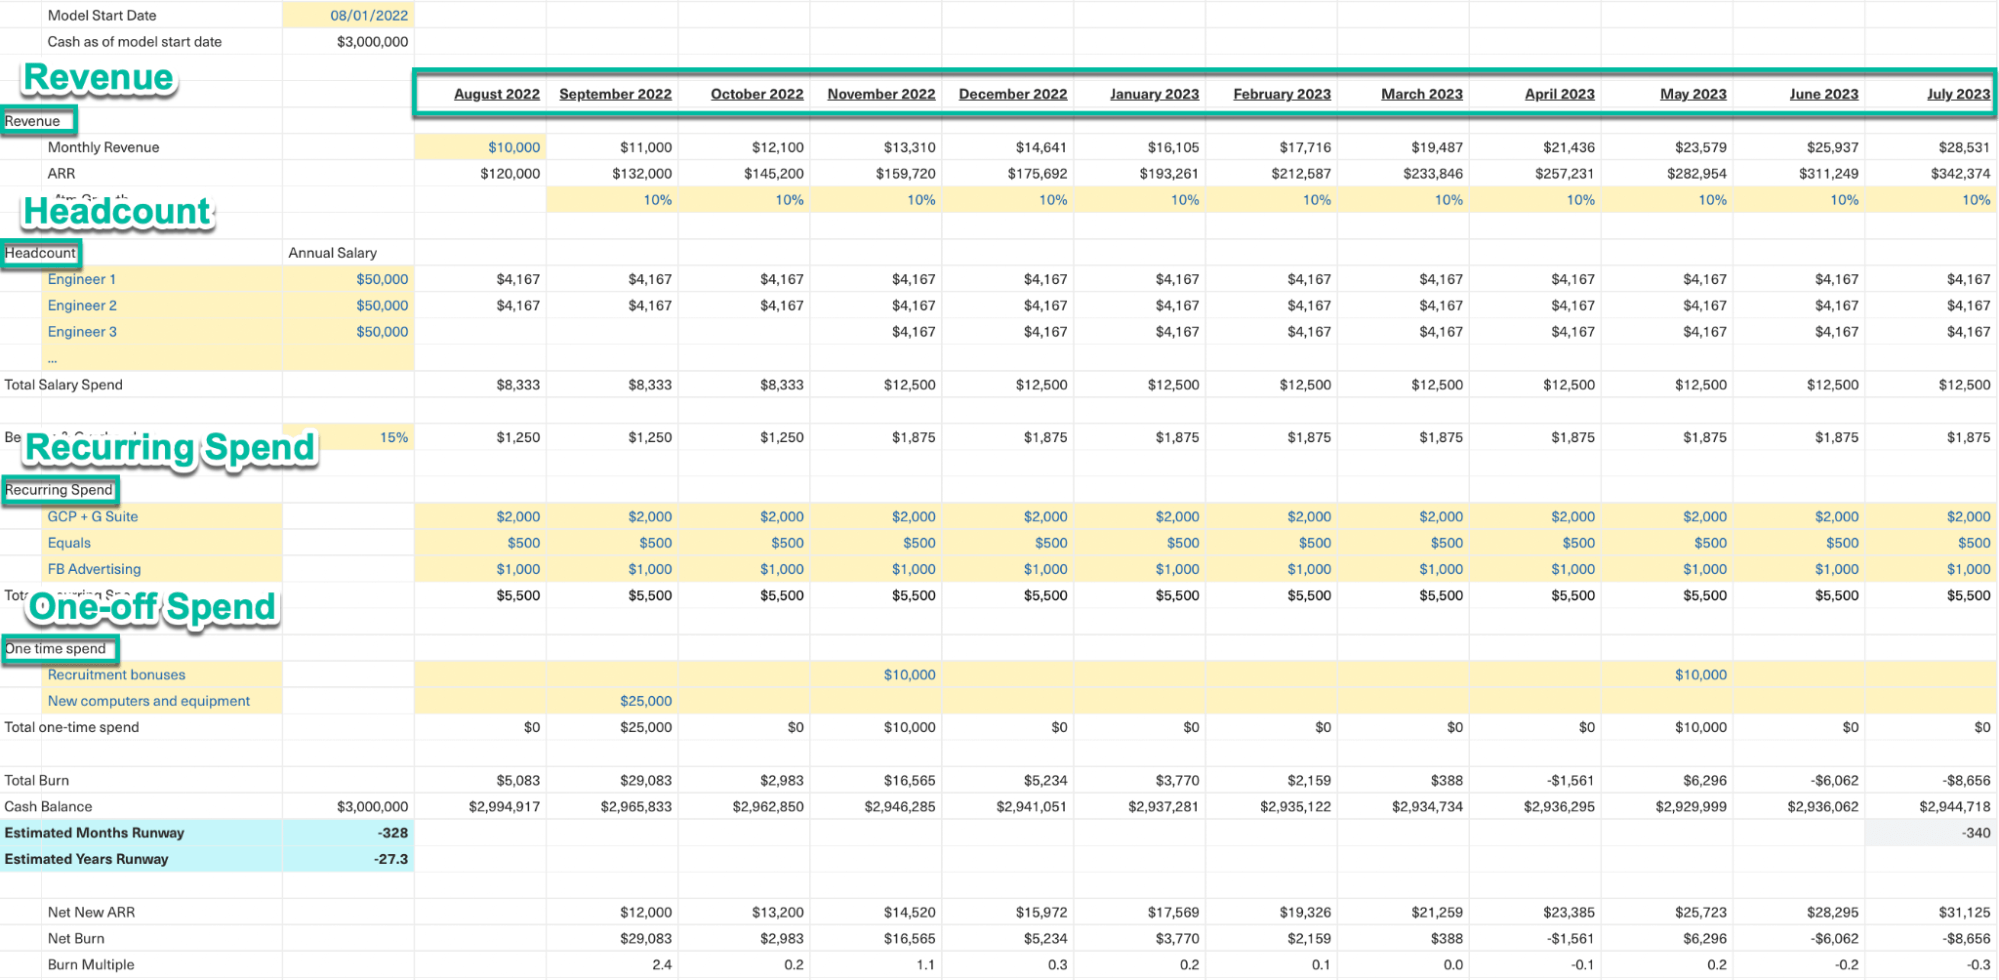
The components of the Cash Burn Model are:
- Revenue: Money you receive each month, for subscriptions, services, or anything else.
- Headcount: Monthly spend on staff, contractors, and benefits and overhead for them.
- Recurring spend: Your regular monthly costs such as office rent, software, and so on.
- One-off spend: One-off costs, such as a tax payments, furniture, and so on.
How to Use It
The Cash Burn Model allows you to systematically understand how your costs and revenue affect your long-term viability, so you can maintain sufficient runway even as you grow.
There are 3 jobs you’ll need to regularly do:
There are 3 jobs you’ll need to regularly do:
- Review your costs and revenue, to know your burn and runway
- Ex: Is there any significant change in the runway? Is this due to increasing cost(s) or decreasing revenue? We observe that ad spending doubled in the last 3 months.
- Decide if anything needs to be done about excess costs
- Ex: Our runway fell from 18 to 16 months, because revenue didn’t grow to make up the gap. We will analyze the Return on Ad Spend and cut channels with low yield.
- Take action and follow up
- Ex: After investigating, we cut new Facebook spend because it had a lower ROAS than LinkedIn. 1 week later, ad spending is 30% less with a minimal drop in New customer MRR. We decide to hold off on further cuts until the runway is stable.
III. Cohort Retention: Customer & Revenue
What It Is
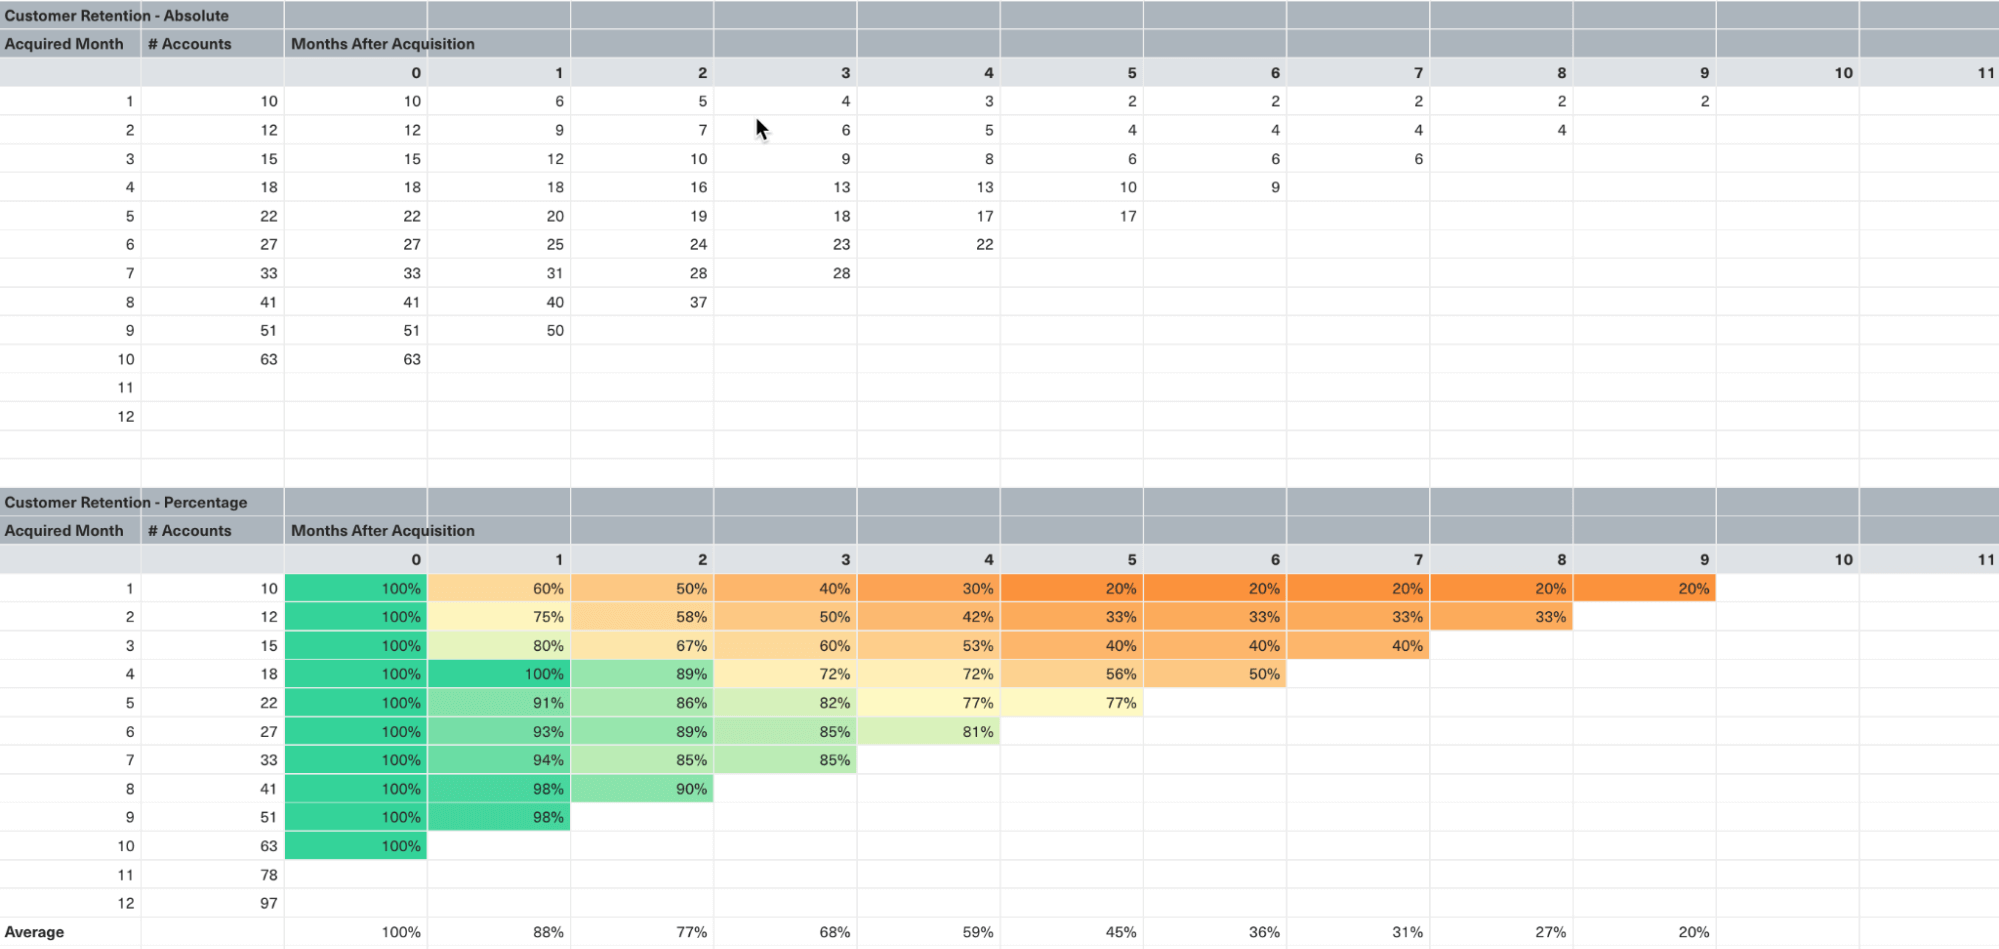
Customer cohort retention groups customers by the date they became paying customers, so you can analyze the retention of these customer cohorts over time. Revenue cohort retention looks at the amount of revenue retained over time for these customer cohorts.
Why It Matters
Analyzing retention on a cohort basis is crucial because retention rates vary significantly between new and long-term customers. By doing so, you can observe how retention changes over the customer's lifetime, compare cohorts, identify trends, and determine how to improve retention.
How to Read It
The best way to understand a triangle chart, also known as a cohort chart, is to see one and break down its elements.
Customer Retention: Absolute

- Rows: represent customer cohorts grouped by the month they joined. The time period can vary, but it's commonly weekly or monthly.
- New Customers Column: shows the number of customers for each month's cohort. For example, February's cohort consists of 88 new customers.
- Lifetime Months: these are the months since the acquisition, also known as the cohort's age. The cells within a lifetime month indicate the remaining customers for that specific cohort. For instance, in the 4th lifetime month of the March cohort, there are 92 customers remaining out of the original 105.
- Putting it all Together: Let's examine the August cohort, which initially had 410 new customers.
- In the 1st lifetime month (September for this cohort), 400 customers remained, indicating 10 churned.
- In the 2nd lifetime month, there were 370 remaining customers.
- The 3rd lifetime month is blank in the example triangle chart as it represents the current month and is how triangle charts get their shape.
- In the 1st lifetime month (September for this cohort), 400 customers remained, indicating 10 churned.
- You’ll often Convert Values to Percentages: you’ll often convert the absolute numbers in each lifetime month to a percentage of the total new customers or revenue for that cohort and apply conditional formatting. This makes it easier to analyze and spot trends.
Note, the above explanation was influenced by Christoph Janz’s recent post, The P9 Guide to Cohort Analysis in SaaS (v0.9). It’s a fantastic in-depth post on cohort retention analysis, detailing what cohorts are, how to create cohort charts, and ways to analyze them.
How to Use It

Customer Retention: Percentage of Original Cohort
There are 3 jobs you’ll regularly need to do with your retention triangle charts:
- Review trends across and within cohorts to answer the following questions:
- Is retention getting better or worse with each new cohort?
- Where are big drops in retention happening across the customer lifetime and does this differ across cohorts?
- Do any cohorts seem to perform far better or worse than others and if so why?
- Is retention getting better over the customer's lifetime i.e. is it flattening out (good) or continuing to decline sharply (bad)?
- Is retention getting better or worse with each new cohort?
- Decide if anything needs to be done about concerning trends
- Ex: If you notice retention always drops in lifetime month 1, there’s likely an issue with onboarding (activation) and you should take action to improve it.
- Take action and follow up
- Ex: You make changes to new customer onboarding to improve activation. In the weeks following these changes, you see if qualitative feedback is positive and if retention is improving for the new cohorts.
IV. Acquisition Funnel Report
What It Is
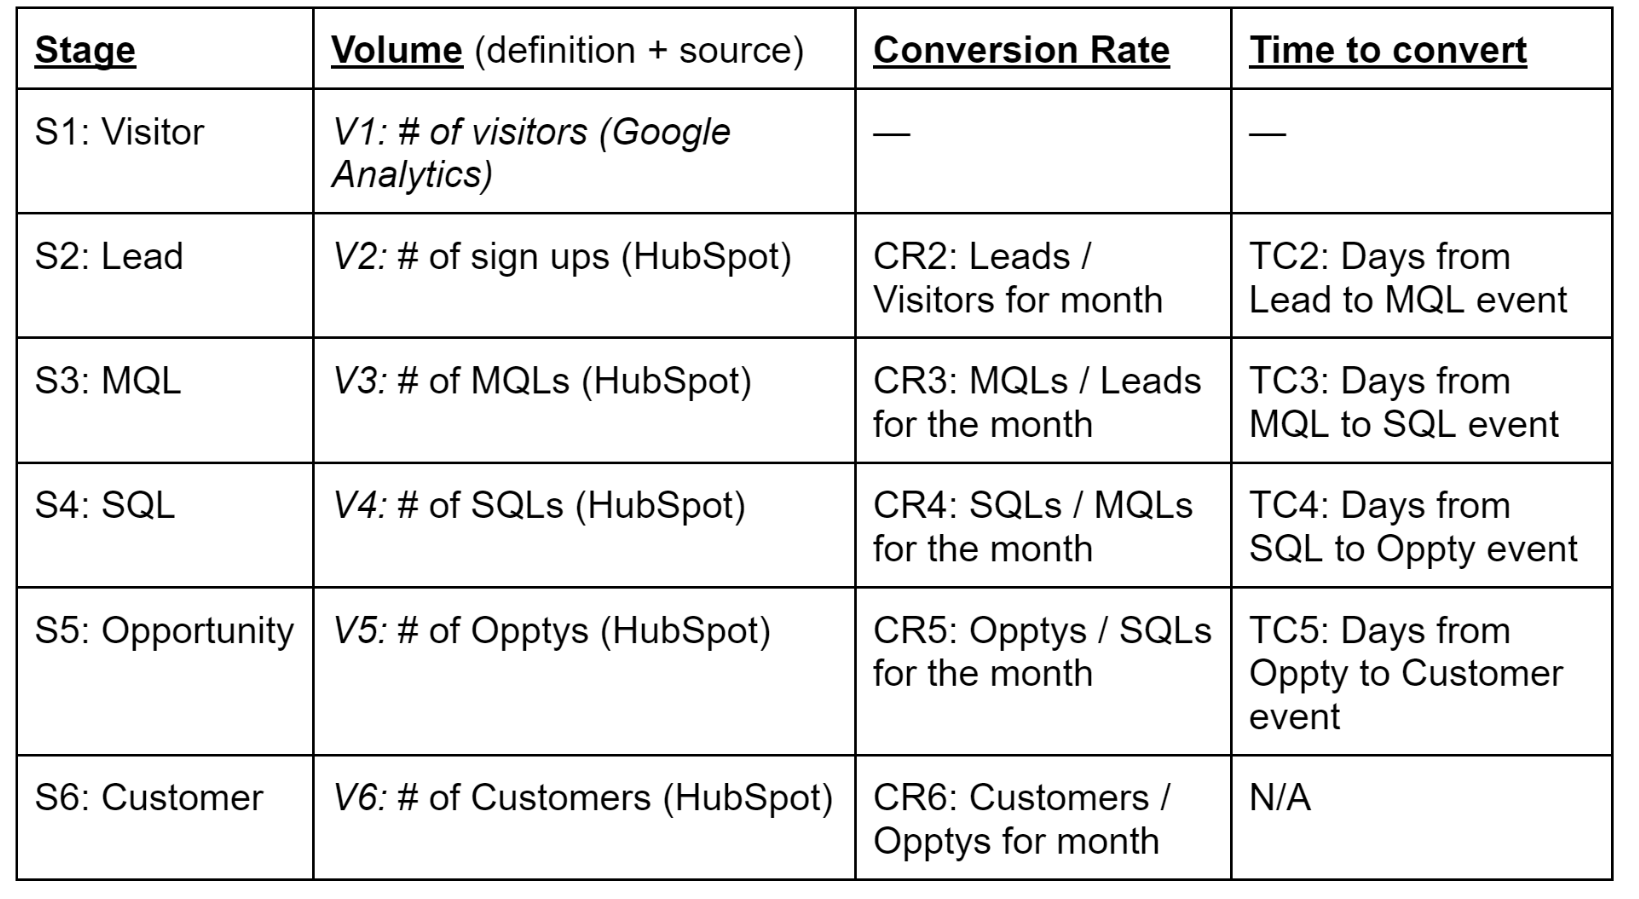
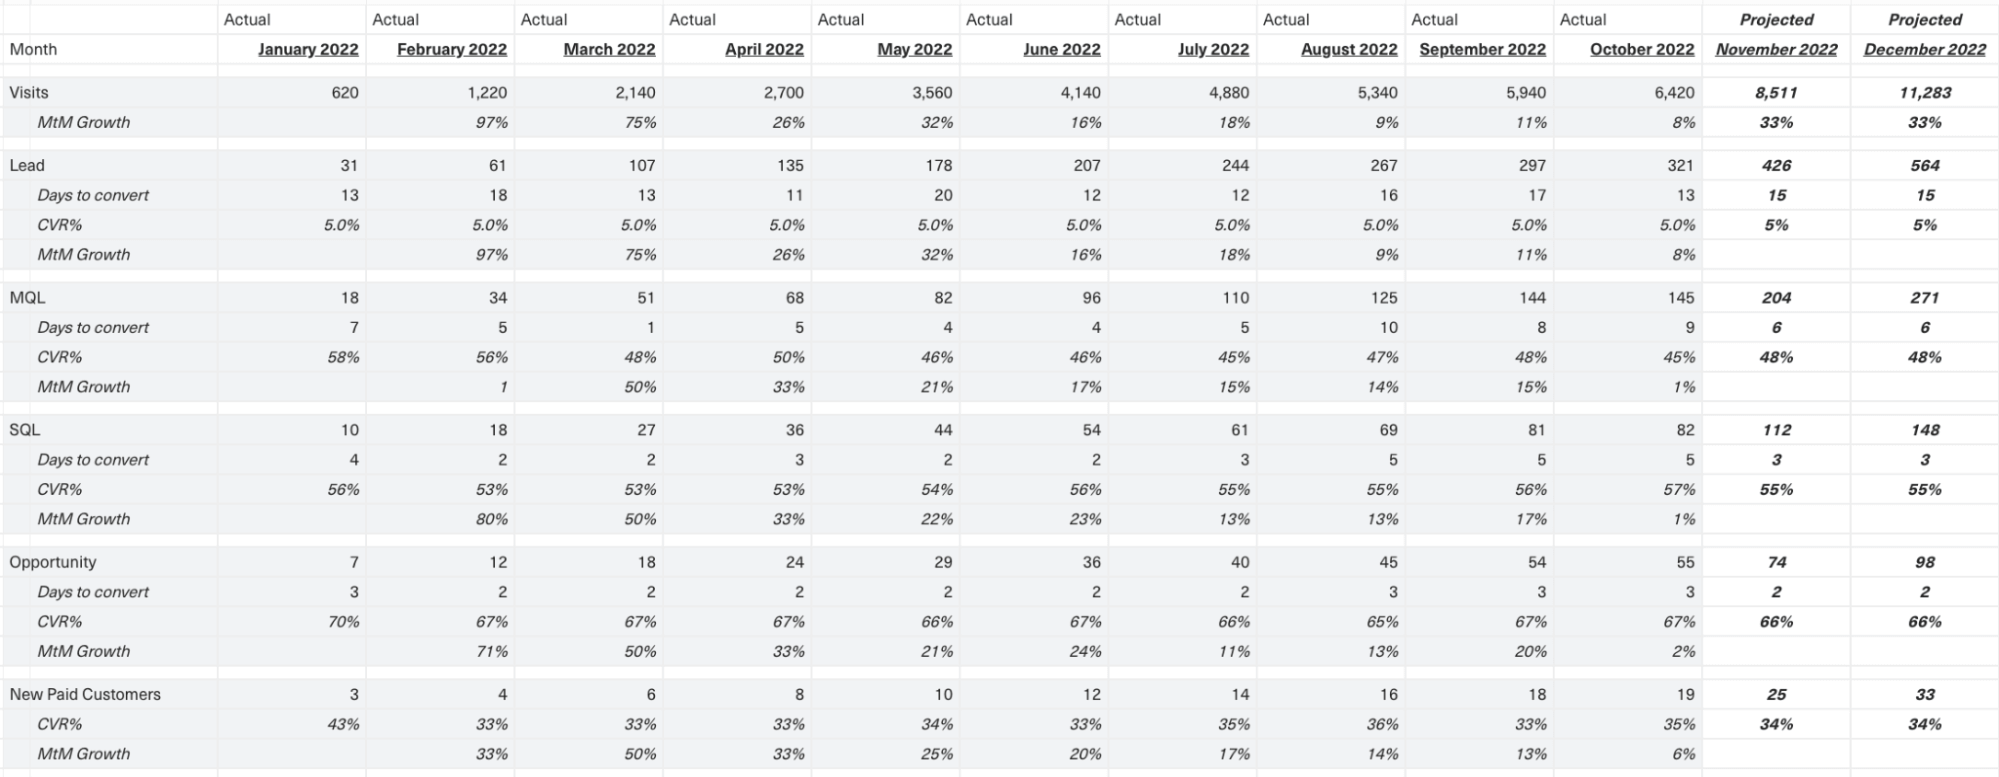
This report captures your funnel stages and 3 key metrics for each: volume, conversion rate, and time to convert (to the next stage). This framework helps you diagnose issues & identify opportunities, prioritize them by impact, and take action to grow your customer base and revenue.
Why It Matters
The Acquisition Funnel Report establishes a foundation for you to see how your leads are coming to you and what’s driving them to convert. It gives you a strong understanding of your funnel levers so you can analyze which ones are the highest yield and prioritize those to accelerate customer and revenue growth.
Even small improvements can yield exponential returns because each customer you acquire is an extra New MRR in that month and an extra Retained MRR for every month thereafter. And, in the early days of a startup, nearly all revenue growth comes from acquiring new customers.
How to Read It
The best way to understand the Acquisition Funnel Report is by analyzing funnel stages, the 3 key metrics for each, and their trends over time. Below are example acquisition funnel stages and definitions for the 3 key metrics, in a typical, inbound Sales-led B2B SaaS startup:
How to Use It
The Acquisition Funnel Report allows you to systematically diagnose and prioritize problems affecting new customer acquisition by their revenue impact.
There are 3 jobs you’ll need to regularly do:
There are 3 jobs you’ll need to regularly do:
- Review trends in volume, conversion rate, and time to convert, by funnel stage
- Ex: We observe that Opportunity volume is down for the past 2 months. Were there changes in prior stage volume, conversion rate, or time to convert?
- Decide if anything needs to be done about concerning trends
- Ex: Opportunity volume being down needs to be addressed. SQL volume was flat, but the conversion rate to Opportunity fell and time to convert grew. We need to make up this shortfall and get to the root cause of it.
- Ex: Opportunity volume being down needs to be addressed. SQL volume was flat, but the conversion rate to Opportunity fell and time to convert grew. We need to make up this shortfall and get to the root cause of it.
- Take action and follow up
- Ex: First we had our SDR team do targeted outbound to the highest likelihood-to-convert MQLs to try and make up the shortfall. Next, we followed this up with an analysis into what caused the drop in Opportunities.
- The week after, we see Opportunity volumes slightly up as some of those re-engaged MQLs were a good fit and intent. We also found that the drop in opportunities coincided with cutting LinkedIn Ads. We now have a case for turning them back on for 1 month, to see their impact.
- Ex: First we had our SDR team do targeted outbound to the highest likelihood-to-convert MQLs to try and make up the shortfall. Next, we followed this up with an analysis into what caused the drop in Opportunities.
Making it a habit
With these 4 reports, you’ll be able to understand your subscription business, manage it, and systematically grow customers and revenue. We recommend reviewing them on a weekly cadence to identify issues and opportunities early and take action to grow your customers and revenue.
Making this an organizational habit means you’ll be proactive instead of reactive. With the insights these reports give, you can start to drive your startup’s growth, giving your team and investors the direction, context, and confidence they need to join you for the journey.
Rahul Reddy and Kyle Doherty are co-founders of RDC , a full-service RevOps & Analytics agency that helps startups adopt foundational SaaS reporting, tools, and processes to accelerate their revenue growth. Their experience includes building the Business Intelligence and Growth Operations teams at Trusted Health, high-leverage Business Operations and Growth Operations work at Intercom, and Data Science and Full Stack Engineering roles earlier in their careers.
Book a Free 45-minute consultation call with RDC to get help with your highest leverage RevOps & Analytics challenges.

